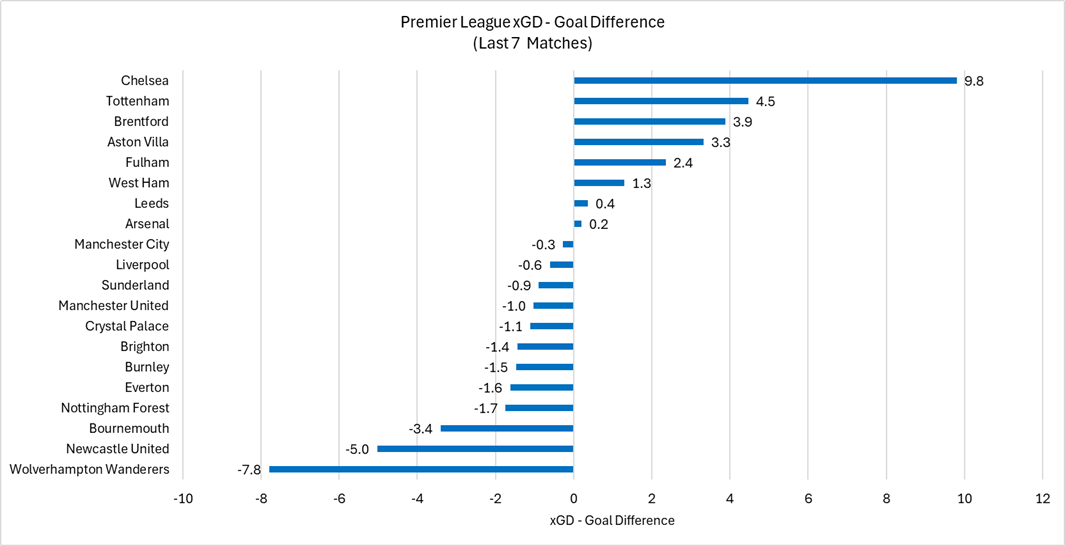
xGD – Goal Difference is one the main ways to look at how a team has performed over a stretch of matches.
The closer to 0 you are, the closer your results are to your actual performance.
* If you’re very negative, your results are better than your performances
* If you’re very positive, your results are worse your performances
Over the last 7 matches (when our results started to turn), Chelsea are the best by this metric at this metric at +9.8, meaning our performances are about 10 GD better than our results deserve. This is driven more by our attacking than our defending, but both have played a role:
xG is 14.77, but we’ve scored 8 goals (underperforming by -6.77)
xGA is 9.97, but we’ve conceded 13 goals (underperforming by -3.03)
Overall, I think everyone knows results have been bad, but they definitely haven’t been deserving of 4 losses in 5 matches. We’ve only had 5 points with an expected points of 12.67, so we’ve had about 7-8 fewer points than our performances “deserve”.
Teams we’ve played during this time: Leeds (H), Burnley (H), Arsenal (A), Aston Villa (A), Newcastle (H), Everton (A), Man City
Duckway767 on
That’s crazy
I think Rosenior is definitely to blame for some results, but overall it’s the players that are underperforming and failing to finish chances. It’s a direct result of going for inexperienced young players (or even just crap players that don’t belong in a team aiming for top spots in the Premier League) rather than proven finishers.
Jor94 on
Great, back in the Graham potter timeline where everyone says we aren’t that bad because of XG
GiganticEvenings on
Statistics are like Bikinis. What they reveal is suggestive, but what they conceal is vital.
Kaapzero on
Keep in mind that xG doesnt always take into account gamestates. Against Newcastle and Everton we were losing most of the game. One game, like Villa can also boost the averages and make it look better than it actually is.
SubparCurmudgeon on
not including CL matches 😬
[deleted] on
[deleted]
ImWhy on
I love how all the comments are the standard “rah rah stats are useless me no understand data” like every fucking team in the world isn’t paying sports scientists a fortune to go through and identify these stats and what they mean for their club and players. Like it or not, this data is a massive reason for the evolution of the sport and improvements in the way teams play and train, just cause you’re too stupid to understand the stats doesn’t mean they’re bad. These stats also making fucking perfect sense for anyone that’s actually watched us play, we look way better than our results show. The data doesn’t lie, we’ve been more threatening going forward but our finishing has been ass. Likewise we’ve actually been better defensively with less chances created against us, but teams have been way more clinical. You can be an old man yelling at clouds all y’all want, but all the data says we’re better under Rosenior. The only thing that hasn’t lined up yet has been the actual results, but acting like it’s the managers fault that players are missing more and keepers/defenders are letting in things they’d normally be expected to stop is hilarious.
RisBest on
Thanks for the great work. Always nice to have some analysis from community. Please continue to post and don’t let the negative people get you down
Aggravating-Fun1389 on
now show us the defensive stats…
OkCommunication339 on
Can’t remember if I said it before but whoever invented all these xG/xA/xGOT/xBOX stats is an absolute genius if their intention was to completely roboticise the game and make other teams obsessed with building tactics based off of optimising them.
Like imagine if this whole time it was Man City or PSG’s masterplan while they continue to play actual football and win based on actually scoring more goals than the opposition.
BLUECO OUT🔵🔵🔵🔵🔵
Maroon_Scorpion on
Doesn’t this simply illustrate that xG is bollocks?
Naarujuana on
Explaining xG to a results driven individual. The next time I miss a sales goal, will highlight my xS (expected sales) to my upline.

")
14 Comments
xGD – Goal Difference is one the main ways to look at how a team has performed over a stretch of matches.
The closer to 0 you are, the closer your results are to your actual performance.
* If you’re very negative, your results are better than your performances
* If you’re very positive, your results are worse your performances
Over the last 7 matches (when our results started to turn), Chelsea are the best by this metric at this metric at +9.8, meaning our performances are about 10 GD better than our results deserve. This is driven more by our attacking than our defending, but both have played a role:
xG is 14.77, but we’ve scored 8 goals (underperforming by -6.77)
xGA is 9.97, but we’ve conceded 13 goals (underperforming by -3.03)
Overall, I think everyone knows results have been bad, but they definitely haven’t been deserving of 4 losses in 5 matches. We’ve only had 5 points with an expected points of 12.67, so we’ve had about 7-8 fewer points than our performances “deserve”.
Teams we’ve played during this time: Leeds (H), Burnley (H), Arsenal (A), Aston Villa (A), Newcastle (H), Everton (A), Man City
That’s crazy
I think Rosenior is definitely to blame for some results, but overall it’s the players that are underperforming and failing to finish chances. It’s a direct result of going for inexperienced young players (or even just crap players that don’t belong in a team aiming for top spots in the Premier League) rather than proven finishers.
Great, back in the Graham potter timeline where everyone says we aren’t that bad because of XG
Statistics are like Bikinis. What they reveal is suggestive, but what they conceal is vital.
Keep in mind that xG doesnt always take into account gamestates. Against Newcastle and Everton we were losing most of the game. One game, like Villa can also boost the averages and make it look better than it actually is.
not including CL matches 😬
[deleted]
I love how all the comments are the standard “rah rah stats are useless me no understand data” like every fucking team in the world isn’t paying sports scientists a fortune to go through and identify these stats and what they mean for their club and players. Like it or not, this data is a massive reason for the evolution of the sport and improvements in the way teams play and train, just cause you’re too stupid to understand the stats doesn’t mean they’re bad. These stats also making fucking perfect sense for anyone that’s actually watched us play, we look way better than our results show. The data doesn’t lie, we’ve been more threatening going forward but our finishing has been ass. Likewise we’ve actually been better defensively with less chances created against us, but teams have been way more clinical. You can be an old man yelling at clouds all y’all want, but all the data says we’re better under Rosenior. The only thing that hasn’t lined up yet has been the actual results, but acting like it’s the managers fault that players are missing more and keepers/defenders are letting in things they’d normally be expected to stop is hilarious.
Thanks for the great work. Always nice to have some analysis from community. Please continue to post and don’t let the negative people get you down
now show us the defensive stats…
Can’t remember if I said it before but whoever invented all these xG/xA/xGOT/xBOX stats is an absolute genius if their intention was to completely roboticise the game and make other teams obsessed with building tactics based off of optimising them.
Like imagine if this whole time it was Man City or PSG’s masterplan while they continue to play actual football and win based on actually scoring more goals than the opposition.
BLUECO OUT🔵🔵🔵🔵🔵
Doesn’t this simply illustrate that xG is bollocks?
Explaining xG to a results driven individual. The next time I miss a sales goal, will highlight my xS (expected sales) to my upline.

Show this to a spurs fan lmao 🤣