
![[ Full Comparison after MW32] Spurs: 23/24 vs 24/25 vs 25/26](https://www.eucup.com/wp-content/uploads/2026/04/ruwblxon5bvg1-1024x568.png "[ Full Comparison after MW32] Spurs: 23/24 vs 24/25 vs 25/26")
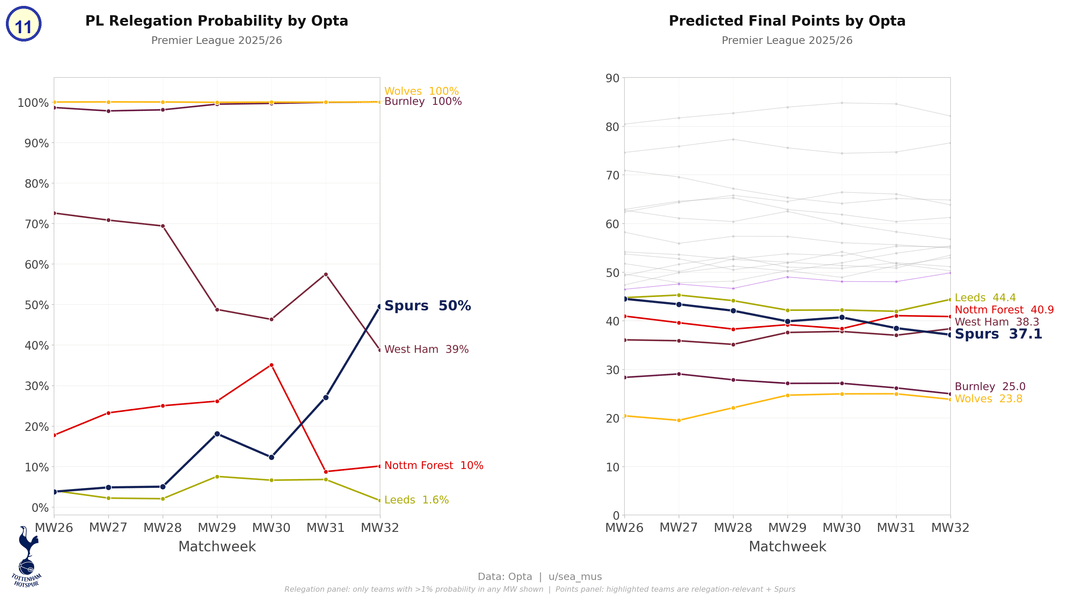
Graph 11: You've seen the relegation probability, already; this is a time-course view.
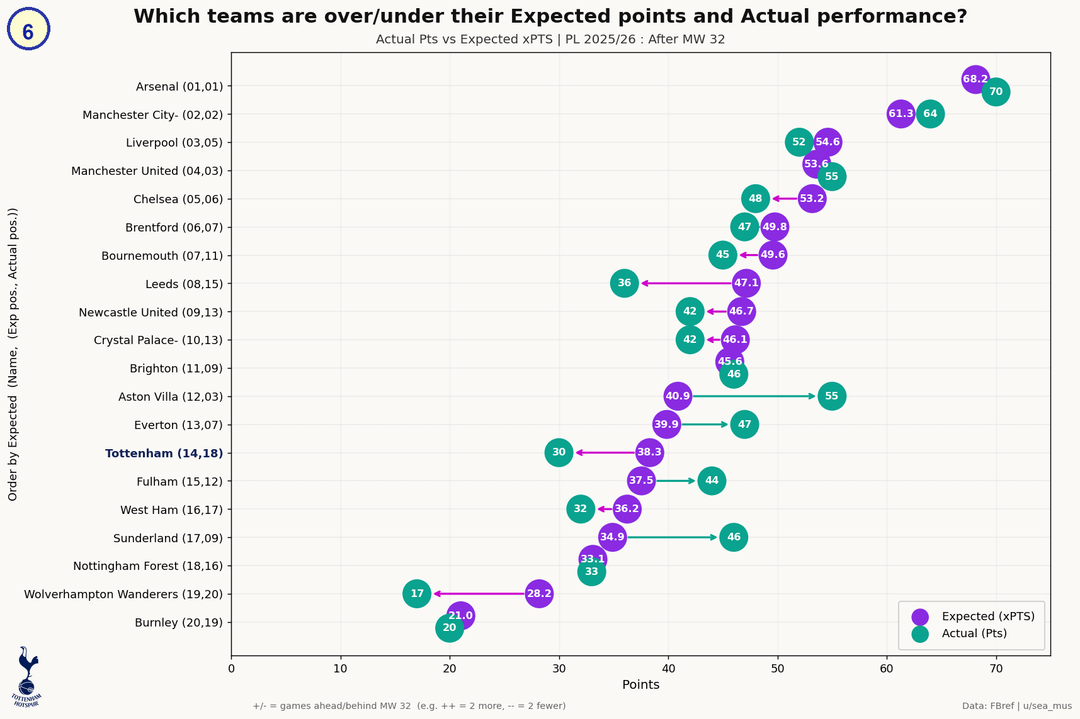
Left panel: We're now the favorites (officially) to be relegated.
Right panel: The projected final points gap between 16th and 18th is 3.8 points.
Note: Opta’s model factors in opponent strength, fixture difficulty, and betting odds, not just raw performance.
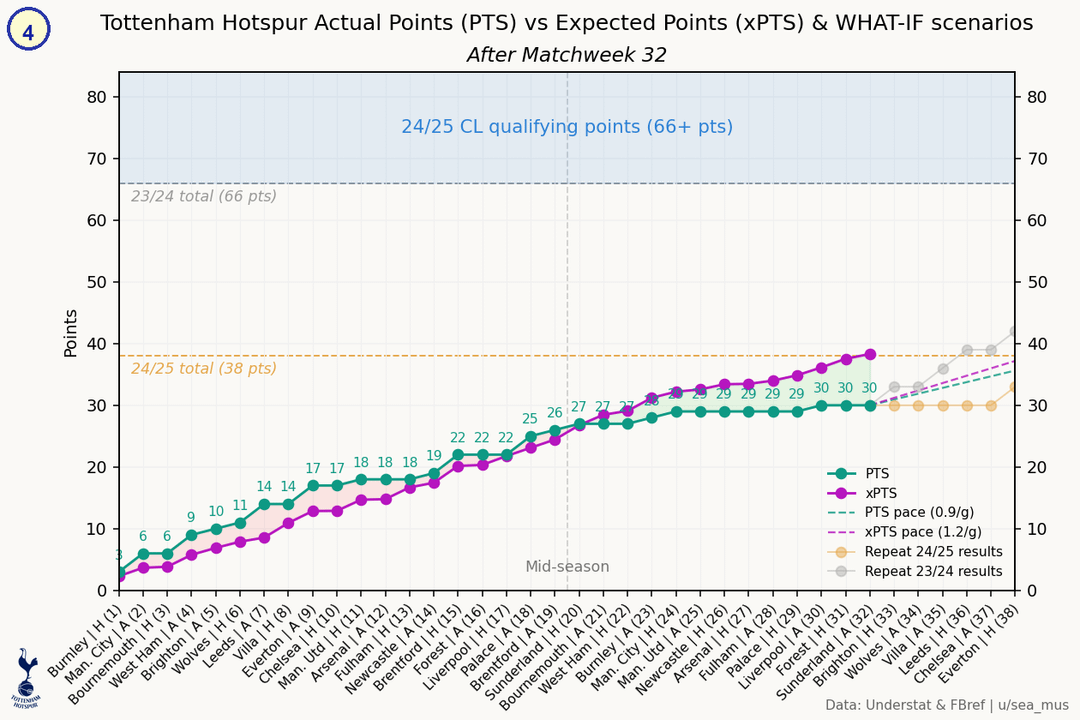
Graph 4:
We’re underperforming our xPTS, a sign of inability to finish the good chances in the rare cases we create them.
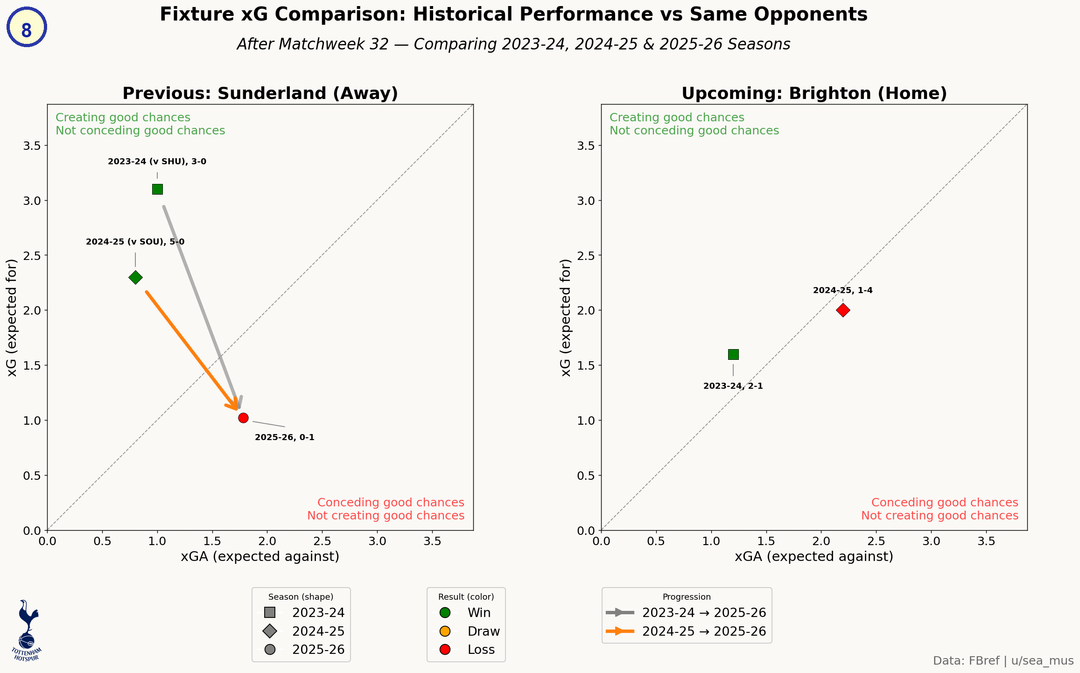
Graph 8:
Left panel: Significantly diminished performance compared to the "equivalent" teams to Sunderland (SHU and SOU)
Right panel: Although we got beaten handily by Brighton at home last year, based on the number and quality of chances created, a draw would have been a fairer result.
by sea_mus